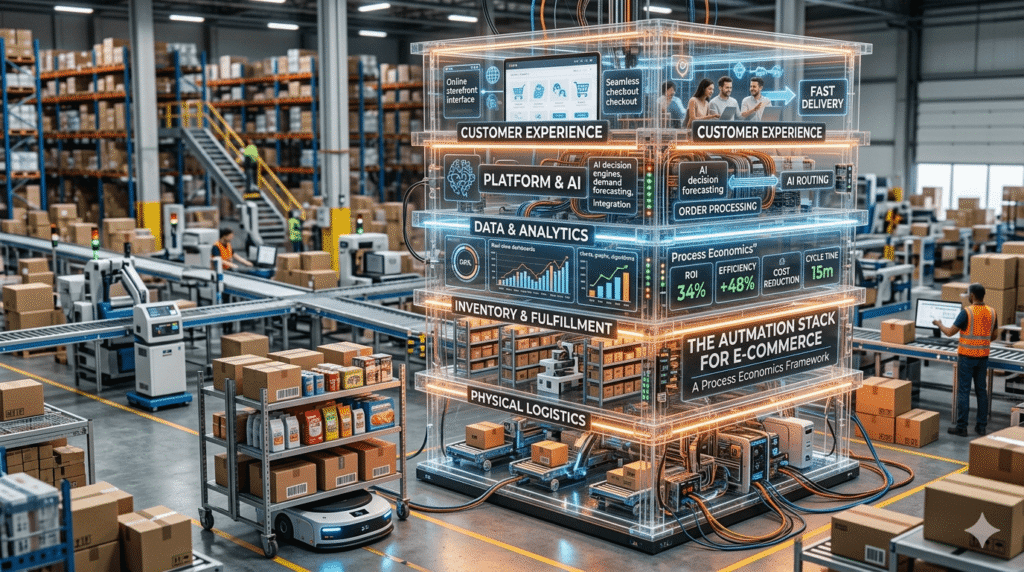
The Wrong Question Is Being Asked Everywhere
The Automation Stack for E-Commerce is often treated as a software problem. That assumption creates expensive mistakes. Most e-commerce teams believe automation decisions are primarily about choosing tools and integrations.
It is not. It is a process economics problem.
The distinction matters enormously in practice. When operators frame automation as a software selection exercise which tools are best, which integrations are cleanest, which platforms have the most features they make a category error that consistently produces the same result: a growing monthly SaaS bill, a fragile web of integrations, and operational complexity that has merely been redistributed rather than resolved.
The correct question is not “what automation tools should we use?” The correct question is: at what point does the economic cost of performing a process manually exceed the economic cost of automating it, and what architecture resolves that gap most efficiently?
That reframe changes everything. It means automation decisions are not primarily technology decisions. They are capital allocation decisions, governed by the same logic that governs any operational investment: what is the cost of the current state, what is the cost of the improved state, and what is the payback period?
Research on organizational automation maturity consistently finds that the most value is captured not by teams using the most tools, but by teams that have developed clarity about which processes to automate, in what sequence, and with what architecture. A 2023 McKinsey analysis of automation value capture found that companies in the top quartile of automation maturity defined as having systematic process prioritization, not simply high tool adoption generated 3.5× the operational cost reduction of companies in the bottom quartile with similar tool spend.[1] Tool selection follows clarity about process economics. It does not precede it.
This article builds the framework for that clarity. It establishes when automation becomes economically rational, what architecture is appropriate at each stage of operational complexity, and how to build a stack that compounds operational leverage rather than accumulating operational debt.
The Automation Density Framework
Before any tool is selected, any workflow is built, or any vendor is evaluated, operators need a consistent way to assess any process against four dimensions. These four dimensions determine not just whether to automate a process, but what class of automation is appropriate.
The Four Axes
Axis 1: Operational Volume How many times does this process execute? Per day, per week, per month? Volume is the most basic automation qualifier. A process that executes 5 times per month rarely justifies the engineering cost of automation. A process that executes 500 times per day almost always does. This axis establishes the denominator against which all other costs are divided.
Axis 2: Workflow Complexity How many decision points, system interactions, conditional branches, and sequential dependencies does the process involve? A low-complexity process (receive order → send confirmation email) can be automated with simple rules. A high-complexity process (evaluate return request → check fraud signals → query inventory → calculate restocking cost → determine refund method → update CRM → notify supplier) requires orchestration.
Axis 3: Exception Frequency What percentage of process executions deviate from the standard path? This axis is where most automation projects underestimate cost and overestimate ROI. A process with 2% exception frequency behaves very differently from one with 15% exception frequency. High exception rates mean human intervention remains a constant fixture regardless of automation and automating high-exception processes without exception-handling design creates failure queues, not efficiency. [Field Estimate] Practitioners commonly observe that exception rates above 8–10% on any given process signal that the process definition itself is unstable, the prerequisite condition for automation has not been met.[2]
Axis 4: Human Judgment Dependency Does resolution require contextual reasoning, relationship knowledge, or discretionary authority that cannot be reduced to explicit rules? Some processes that appear complex are fully rule-reducible: inventory reorder triggers, order confirmation emails, ad spend reporting. Others that appear simple are not: a long-term wholesale customer requesting an exception to return policy, a supplier dispute requiring negotiation history, a flagged order requiring fraud judgment in context.
Automation Class Selection
These four axes map to three classes of automation:
Class 1 Deterministic Rule Automation Applicable when: High volume, low complexity, low exception frequency, low judgment dependency. Implementation uses workflow tools, native platform automations, and connector-class tools (Zapier, Shopify Flow). These are reliable, cheap to operate, and fail gracefully. Most e-commerce businesses are under-utilizing this class while over-investing in higher classes.
Class 2 Orchestrated Automation Applicable when: High volume, medium-to-high complexity, moderate exception frequency, low-to-medium judgment dependency. Implementation uses iPaaS platforms (Make, n8n), custom middleware, and multi-step workflow engines with conditional logic. This is where most growing e-commerce operations should be directing the majority of their automation investment.
Class 3 AI Agent Automation Applicable when: High volume, high complexity, high exception frequency, medium-to-high judgment dependency. Implementation uses LLM-backed agents with tool use, decision memory, and escalation logic. This class is expensive to build correctly, produces high ROI when fit is correct, and produces high cost and operational risk when deployed prematurely or in wrong-fit scenarios.
The Automation Density Framework is not a one-time assessment. It should be reapplied to every process at every stage of business growth, because the axes change as the business scales. A process that was Class 1-appropriate at 50 orders/day may become Class 2-appropriate at 500 orders/day simply because volume has made its exception burden unmanageable at the original automation architecture.
The Breakpoint Model: Where Manual Becomes Irrational
Scale changes the economics of every operational process. The following model traces how key e-commerce workflows shift across four order volume thresholds.
Important epistemic note on the thresholds: The specific order volumes used (50, 200, 500, 2,000/day) are illustrative anchors, not industry-standard breakpoints derived from controlled research. They are grounded in the labor cost formulas that follow operators should recalculate using their own labor rates and exception frequencies. The directional logic (that each threshold introduces a qualitatively new class of operational challenge) is consistent with published research on operational scaling. The specific numbers are [Field Estimate] calibrated to a team with $25–35/hour fully-loaded labor cost; higher labor costs shift breakpoints earlier.
Tier 1: ~50 Orders/Day
At this volume, the operator is typically a founder or small team of 2–4 people. The critical insight here is that the cost of building and maintaining automation frequently exceeds the labor cost of doing things by hand and the process definitions are not yet stable enough to automate reliably.
What breaks first: Customer support response time. At 50 orders/day with a 2–3% issue rate, approximately 1–2 support tickets per day require resolution. This is manually manageable. But the time cost of navigating between systems tracking a package, processing a return, retrieving order details, creates disproportionate handle time. This is the first place Class 1 automation creates real return: not by eliminating support, but by reducing the system-navigation burden per ticket.
What is rational at this stage: Order confirmation and shipping notification emails (platform-native automations), abandoned cart recovery (platform-native), basic low-inventory alerts (platform threshold triggers). These require minimal configuration, near-zero maintenance, and create immediate customer experience improvement.
Shopify’s 2024 Commerce Trends report identifies cart abandonment recovery as the highest-ROI automation available to early-stage e-commerce operators, with median revenue recovery rates of 5–15% of abandoned cart value, achievable through platform-native tools requiring no additional tooling cost.[3]
What not to automate yet: Returns processing end-to-end, customer support routing, pricing adjustments, ad reporting pipelines. The volume does not justify the build cost, and process definitions at this stage are typically still evolving.
Labor math: [Field Estimate] At 50 orders/day, manual operational overhead fulfillment coordination, basic inventory monitoring, customer communication requires an estimated 1.5–2.5 hours of operational labor per day. At $28/hour fully-loaded, that is $1,200–$1,960/month. The native automations available at this stage (platform-included, zero marginal cost) recover approximately 30–45 minutes per day. Payback period: immediate, as the tools are already included in platform subscriptions.
Tier 2: ~200 Orders/Day
This is the first genuine automation inflection point. At 200 orders/day, the manual process burden reaches a threshold where it consistently consumes the equivalent of significant dedicated operational headcount across order management, inventory updates, customer communications, and exception handling.
Shopify’s operational scaling research identifies multi-channel inventory synchronization as the process that most commonly fails first at this order volume range. Businesses operating across 2+ sales channels without automated inventory synchronization report systematic oversell incidents that generate both direct refund costs and customer trust erosion.[4]
What breaks first: Inventory synchronization and multi-channel order routing. [Field Estimate] At 200 orders/day across two channels without automated sync, practitioners commonly report oversell rates of 2–5% on affected SKUs meaning 4–10 potential oversell incidents per day requiring individual resolution. Each resolution typically requires customer contact, manual refund processing, and reputational damage management. The labor cost of this exception cascade rapidly justifies an inventory synchronization layer.
What is rational at this stage:
Inventory sync: An integration layer connecting all sales channels to a single inventory source of truth (Linnworks, Skubana, or Make.com connecting channel APIs directly). This is a Class 2 automation for multi-channel businesses and Class 1 for single-channel.
Order routing: Rule-based fulfillment routing based on warehouse proximity, carrier availability, and item type. Class 1 or Class 2 depending on routing complexity.
Customer support: A help desk platform (Gorgias, Freshdesk) with macro-based response templates and ticket tagging. This is not yet AI agent territory. Structured template automation reduces human handle time significantly without requiring AI infrastructure. Gorgias’s 2024 Ecommerce Customer Experience Benchmark found that e-commerce merchants using macro-based automation reduced average first response time by 67% and reduced support tickets requiring manual resolution by 40–55%, with the improvements concentrated in standard order status and shipping inquiry categories.[5]
Returns: A defined return portal with rule-based eligibility checking (Loop Returns, Return Prime). Reduces manual return assessment to exceptions only.
Labor math worked example:
Using the Breakpoint Calculator formulas introduced below:
- Process: Manual customer support at 200 orders/day (3% issue rate = 6 tickets/day)
- T_exec per ticket: 12 minutes (system navigation + response drafting)
- Monthly volume: ~180 tickets
- T_exec: 0.2 hours | Labor rate: $28/hour fully-loaded
- Exception rate within support: 15% requiring escalation (27 tickets/month)
- T_exc per escalation: 45 minutes
MLCprocess = (0.2 × 180 × $28) + (0.75 × 27 × $28) = $1,008 + $567 = $1,575/month
With a help desk and macro automation:
- Handle time reduction to 5 minutes per ticket
- Tool cost: $360/month (Gorgias Pro)
- Build time: 8 hours at $50/hour = $400 amortized over 12 months = $33/month
MACprocess = $33 + $0 maintenance (macros self-maintaining) + $360 = $393/month
Net monthly value: $1,575 − $393 = $1,182/month Payback period: (8 × $50) / $1,182 = 0.34 months (~10 days)
The same calculation applied to inventory synchronization at this volume produces even faster payback because exception cost per incident is higher (full order refund + labor vs. handle time only).
Tier 3: ~500 Orders/Day
At 500 orders/day, the business has moved past reactive automation into the territory where automation architecture not just individual automated workflows determines operational ceiling. The question shifts from “which processes should be automated” to “how do automated systems communicate with each other, and what happens when they conflict?”
This is where Class 2 orchestration becomes essential. Individual automations built in isolation begin producing contradictory actions: an inventory sync updates stock levels while an order routing system simultaneously attempts to fulfill against stale data; a customer support macro resolves a ticket while the returns system has already processed a conflicting action.
Research on enterprise integration complexity from Gartner’s integration platform analysis documents what they term “integration debt” the compounding cost of point-to-point integrations that grows quadratically with tool count. A stack of 8 tools with direct integrations has potentially 28 integration pairs to maintain; introducing a central orchestration layer reduces this to 8 managed connections.[6] At 500+ orders/day, this architectural decision directly determines whether operational teams spend time on value-creating work or integration maintenance.
What breaks first: Exception management and system coherence. [Analytical Derivation] At 500 orders/day with a conservative 3% exception rate, the business manages approximately 15 order exceptions per day. Each exception touches multiple systems. Without orchestration, a central workflow layer managing cross-system state exceptions require manual navigation across 4–6 systems per incident. At 30 minutes of handling time per exception (conservative), this represents 7.5 hours of daily exception labor, or roughly one full-time employee dedicated entirely to exception resolution.
What is rational at this stage:
Workflow orchestration layer: A dedicated iPaaS platform (Make.com at this scale, n8n for teams with developer capacity, or Zapier Advanced for teams preferring managed infrastructure) managing cross-system event flows. All significant operational events new order, inventory change, return initiated, support ticket created should flow through this layer to create observability and coherence.
Pricing automation: Rule-based dynamic pricing adjustments based on competitor pricing, inventory levels, and demand signals (Prisync, Feedvisor, or custom rules via the orchestration layer). Class 2 automation with explicitly defined rule sets.
Ad reporting and spend visibility: Automated reporting dashboards (Triple Whale, Northbeam, or custom data pipeline via Looker Studio) that surface ROAS, CAC, and attribution data without manual extraction. Class 1 reporting automation with significant time recovery.
Financial reconciliation: Automated transaction matching between platform payouts, bank accounts, and accounting software. A2X’s integration documentation covers automated reconciliation for Shopify, Amazon, and multi-currency environments, with the product designed to handle the reconciliation complexity that emerges specifically in the 200–2,000 order/day range.[7]
Supplier communication: Automated purchase order generation triggered by inventory threshold events. Class 1–2 depending on supplier system integration.
Labor math: [Field Estimate] Without orchestration at 500 orders/day, operational coordination labor across fulfillment management, exception handling, cross-system updates, and reporting typically requires 15–22 hours/day of combined team labor. Well-implemented orchestration concentrates this burden on exception management and judgment-requiring decisions, reducing coordination overhead by an estimated 50–65%. At $28/hour fully-loaded, a 10-hour daily reduction represents approximately $84,000 in annual labor cost avoidance. Stack cost at this stage runs $2,500–4,500/month ($30,000–54,000 annually). Net annual value: $30,000–54,000. Payback period: under 6 months on implementation cost.
Tier 4: ~2,000+ Orders/Day
At this scale, the automation challenge is no longer process automation alone, it is system intelligence. The volume of operational data, the complexity of cross-channel interactions, and the speed at which exceptions must be resolved make purely rule-based orchestration insufficient for high-stakes, high-variability processes.
This is where AI agents enter the rational conversation with critical precision about where they actually create leverage.
Anthropic’s guidance on building effective agents specifies that agent workflows are most valuable when: tasks benefit from iterative checking and correction, tasks are too complex for single-pass rule-based processing, or when the cost of human review at full volume makes oversight economically irrational.[8] At 2,000+ orders/day, several e-commerce processes meet this threshold but the majority still do not.
What breaks first: Support quality consistency and fraud/exception decision speed. At 2,000 orders/day with a 3% issue rate, the business manages approximately 60 support and exception events per day. Macro-based support templates, which worked at Tier 2, now produce a pattern of low-quality resolutions for edge cases, cases that are individually rare but collectively frequent at this volume. Fraud review at this scale also requires speed that human reviewers cannot match without systematic decision assistance.
What is rational at this stage:
AI-assisted customer support (not full autonomy): LLM-backed support agents that handle first-response resolution for standard issue categories and escalate complex cases with context summary. Intercom’s 2024 Customer Service Trends Report documented first-contact resolution rates of 45–67% for well-configured AI support agents on e-commerce help desks, with the variance attributable primarily to quality of product and policy knowledge provided to the agent, not model capability. [9] The operative model here is hybrid: AI handles volume, humans handle edge cases with AI-generated context summaries.
ML-based demand forecasting: Statistical and ML-based forecasting integrated with procurement triggers, particularly for seasonal and trend-sensitive SKUs. McKinsey’s supply chain research found that ML-based demand forecasting in retail operations reduced inventory carrying cost by 15–30% while simultaneously reducing stockout frequency, compared to rule-based reorder systems.[10]
Fraud risk scoring: Automated risk scoring with human review reserved for threshold-exceeding cases. Class 2 → Class 3 depending on sophistication of implementation.
Labor math: McKinsey’s 2023 analysis of automation in retail and e-commerce operations found that mature automation programs in retail operations generated operational cost reductions of 20–35% on administrative and fulfillment coordination functions.[11] For a mid-market operator processing 2,000 orders/day with an operations team of 15–25 people, the 20–35% administrative cost reduction represents $200,000–500,000 in annual cost avoidance depending on labor market and team composition. Stack investment at this scale runs $15,000–25,000/month. Payback period with sound architecture: typically 6–12 months.
The Breakpoint Calculator
Every automation decision should pass a basic economic test before implementation. The following formula set makes that explicit.
Formula 1: Monthly Labor Cost of Manual Process
MLCprocess = (T_exec × V_monthly × L_rate) + (T_exc × V_exc × L_rate)
- T_exec = average time per normal execution (hours)
- V_monthly = monthly execution volume
- L_rate = fully-loaded hourly labor cost (base salary × 1.3–1.5 to account for benefits, overhead, management cost)
- T_exc = average time per exception (hours)
- V_exc = monthly exception volume (V_monthly × exception rate %)
Formula 2: Monthly Automation Cost
MACprocess = (T_build × E_rate / 12) + (T_maintain × E_rate) + Tool_cost
- T_build = hours to build the automation
- E_rate = hourly cost of builder (developer or operations generalist)
- T_maintain = monthly maintenance hours
- Tool_cost = monthly tool cost allocated to this process
Formula 3: Net Monthly Value
NMV = MLCprocess − MACprocess
Any positive NMV indicates the automation is economically justified. Higher NMV indicates higher priority for implementation.
Formula 4: Payback Period
PP = (T_build × E_rate) / NMV
Expressed in months. The build cost is the one-time investment; NMV is the monthly return on that investment.
Decision thresholds:
- PP under 3 months → implement immediately
- PP 3–9 months → strong candidate, implement in next planning cycle
- PP 9–18 months → implement if strategically justified beyond direct ROI (e.g., creates foundation for future automations)
- PP over 18 months → defer, or reconsider whether the process is a genuine automation candidate
Inventory sync example at 200 orders/day: [Analytical Derivation]
- T_exec: 0.033 hours (2 min per manual sync update) | V_monthly: 6,000 | L_rate: $28
- Exception rate: 4% | V_exc: 240 | T_exc: 0.5 hours
- MLC = (0.033 × 6,000 × $28) + (0.5 × 240 × $28) = $5,544 + $3,360 = $8,904/month
- T_build: 20 hours | E_rate: $75/hour | T_maintain: 2 hours | Tool_cost: $400/month
- MAC = (20 × $75 / 12) + (2 × $75) + $400 = $125 + $150 + $400 = $675/month
- NMV = $8,904 − $675 = $8,229/month | PP = (20 × $75) / $8,229 = 0.18 months (~5 days)
This is among the highest-ROI automations available at this scale because exception cost is high (full refund + labor per oversell incident vs. handle time for support tickets). Not all automations produce this result. The calculator makes the variation visible.
Stack Architecture by Stage
Quick Reference: Stack Evolution Summary
| Stage | Revenue | Orders/Day | Primary Bottleneck | Automation Class | Monthly Stack Cost |
|---|---|---|---|---|---|
| Starter | $500K–$2M | <100 | Founder time, basic CX | Class 1 only | $230–$315 |
| Growth | $2M–$10M | 100–500 | Inventory sync, support volume | Class 1–2 | $2,200–$3,800 |
| Operator | $10M–$50M | 500–2,000 | Exception management, system coherence | Class 2 dominant | $9,850–$18,750 |
| Scale | $50M+ | 2,000+ | Support quality, demand intelligence | Class 2 + selective Class 3 | $25,000–$60,000 |
Starter Stack
Revenue: $500K–$2M | Volume: <100 orders/day
Operational characteristics: Single channel, small team, unstable process definitions, cash-constrained.
Primary bottleneck: Founder operational time and customer experience consistency.
| Function | Tool | Monthly Cost | Evidence Basis |
|---|---|---|---|
| E-commerce platform | Shopify (Basic/Grow) | $79–$105 | Official pricing |
| Email/SMS marketing | Klaviyo | $45–$100 | Official pricing |
| Help desk | Gorgias Starter | $10 | Official pricing |
| Returns | Loop Returns Starter | $99 | Official pricing |
| Workflow automation | Shopify Flow | Included | Official documentation |
| Analytics | Google Analytics 4 | Free | Official documentation |
Estimated total: $233–$314/month
ROI logic: Every tool at this stage must run without significant ongoing management. Complexity is a liability, not an asset. The Starter Stack’s ROI comes primarily from cart recovery automation and shipping notification consistency two levers with near-zero marginal cost that directly impact revenue recovery and customer trust. Shopify data cited in their 2024 Commerce Trends report indicates cart recovery flows recover 5–15% of abandoned cart value,[3] making this the highest unambiguous ROI automation available to early-stage operators.
Growth Stack
Revenue: $2M–$10M | Volume: 100–500 orders/day
Operational characteristics: Multi-channel emerging, team of 5–15, process stabilization underway, support volume straining manual capacity.
Primary bottleneck: Inventory synchronization, support handle time, financial reporting lag.
| Function | Tool | Monthly Cost | Evidence Basis |
|---|---|---|---|
| E-commerce platform | Shopify Advanced | $399 | Official pricing |
| Inventory/channel sync | Linnworks or Skubana | $449–$999 | Official pricing |
| Help desk | Gorgias Pro | $360 | Official pricing |
| Returns | Loop Returns Growth | $399 | Official pricing |
| Workflow orchestration | Make.com Team | $100–$200 | Official pricing |
| Email/SMS | Klaviyo | $200–$600 | Official pricing |
| Ad analytics | Triple Whale | $129–$299 | Official pricing |
| Accounting sync | A2X | $79–$229 | Official pricing |
| Reviews | Okendo | $99–$299 | Official pricing |
Estimated total: $2,214–$3,784/month
ROI logic: [Analytical Derivation] The primary ROI driver at this stage is inventory synchronization, which eliminates the exception cost of oversell incidents, and support automation, which reduces handle time per ticket. Using the Breakpoint Calculator: at 300 orders/day with a 3% issue rate and a 4% oversell rate on multi-channel inventory, the combined monthly labor cost of unautomated support and inventory exceptions runs $12,000–$18,000. The stack cost of $2,200–$3,800 against avoided labor of $12,000–$18,000 produces a net monthly value of $8,200–$14,200. Payback period on implementation: under 2 months.
Operator Stack
Revenue: $10M–$50M | Volume: 500–2,000 orders/day
Operational characteristics: Multi-channel mature, 15–50 employees, established process definitions, exceptions becoming the primary operational burden.
Primary bottleneck: Cross-system coherence, exception volume, pricing competitiveness, financial reporting speed.
| Function | Tool | Monthly Cost | Evidence Basis |
|---|---|---|---|
| E-commerce platform | Shopify Plus | $2,000–$2,500 | Official pricing |
| Inventory/WMS | Brightpearl or Extensiv | $1,500–$3,000 | [Field Estimate — enterprise contract pricing] |
| Help desk + AI | Gorgias Enterprise + AI | $900–$1,500 | Official pricing |
| Returns | Loop Returns Plus | $749 | Official pricing |
| Workflow orchestration | n8n (self-hosted) or Make Enterprise | $500–$1,000 | Official pricing |
| Email/SMS | Klaviyo | $600–$2,000 | Official pricing |
| Ad analytics | Northbeam or Triple Whale Scale | $500–$1,500 | [Field Estimate — contract-based] |
| Pricing intelligence | Prisync | $399–$999 | Official pricing |
| ERP/Accounting | NetSuite or QBO Enterprise + A2X | $1,000–$3,000 | [Field Estimate — NetSuite contract-priced] |
| Reviews/UGC | Yotpo Growth | $500 | Official pricing |
| BI/Dashboards | Looker Studio + connectors | $200–$500 | Official documentation |
Estimated total: $8,848–$17,749/month
ROI logic: [Field Estimate, no controlled study isolates this variable independently] At this stage, the ROI profile diversifies. Pricing intelligence alone can generate significant margin improvement on competitive SKUs. Practitioners report 1.5–4% margin improvement on dynamically-priced SKUs following automated competitive repricing implementation. At $25M revenue with 30% of SKUs dynamically priced, a conservative 2% margin improvement on that segment represents $150,000 in annual additional margin roughly the annual cost of the full stack. Exception handling automation, financial reporting speed, and support quality improvement create additional value that compounds on top of pricing gains.
Scale Stack
Revenue: $50M+ | Volume: 2,000+ orders/day
At this stage, the stack becomes bespoke. Architecture principles take precedence over specific tool prescriptions because at this scale, the correct tools depend on existing infrastructure, technical team capacity, and specific channel mix. The governing principles:
- Custom data infrastructure (Snowflake or BigQuery as operational data backbone) justified at this scale by the volume of cross-system data requiring synthesis
- API-first architecture with custom middleware replacing generic iPaaS for core workflows
- AI agent deployment for customer support first-response, demand forecasting assistance, and anomaly detection but on a deterministic orchestration foundation, not as a replacement for it
- Dedicated operations engineering headcount (1–3 FTE depending on automation complexity)
- All automation has observability instrumentation: logging, alerting, error queue management, and regular accuracy auditing
McKinsey’s 2023 retail operations research found that mature AI/automation programs in retail generated 20–35% operational cost reduction on administrative and coordination functions. Separately, Intercom’s 2024 AI customer service data found first-contact resolution rates of 45–67% for well-configured AI support agents [9] at a $50M+ operator with a support team of 20 agents, this represents 9–13 agents’ worth of first-contact volume handled without human intervention.
Estimated tooling cost: $25,000–$60,000/month + $150,000–$400,000/year in operations engineering headcount
Anti-Patterns That Destroy Automation ROI
1. Automating Broken Processes
The most expensive automation mistake. When a process has unclear ownership, inconsistent inputs, or variable decision logic, automating it does not fix it, it accelerates the dysfunction and makes it harder to diagnose. A manual process that fails 20% of the time will fail in exactly the same scenarios when automated, but it will now fail at full velocity, without a human to intercept errors, and the failures will cascade into downstream systems before detection.
Diagnostic signal: If you cannot document every exception type and its resolution logic before building an automation, the process is not ready to automate.
Correction: Document and stabilize through at least 30 days of consistent manual execution. Map every exception. Define resolution logic for the top 5 exception types by frequency. Then automate. The documentation process itself frequently reveals process redesign opportunities that eliminate exceptions before automation is built.
2. Tool Accumulation Without Architecture
Operators often add tools reactively: a support problem gets a help desk, an inventory problem gets a sync tool, a reporting problem gets an analytics tool. Each tool solves a local problem while creating global complexity. Without an integration architecture connecting these tools through defined event flows, a stack of 10 tools creates up to 45 potential integration pairs, most of which are undocumented and brittle.
Gartner’s research on integration complexity in digital operations documents that point-to-point integrations become the primary maintenance burden not the tools themselves above 8–10 tools in a stack.[6] The architectural correction (introducing a central orchestration layer) reduces maintenance overhead dramatically while simultaneously improving system observability.
Correction: Before adding any new tool, map its integration surface. Identify every system it communicates with. Determine whether a new direct integration is being created or whether the communication flows through the orchestration layer. Every tool should have a defined place in the architecture before it is provisioned.
3. Automating Exceptions
Exceptions exist because they don’t conform to standard logic. Attempting to automate exception resolution before exceptions are understood, categorized, and sufficiently frequent to justify a dedicated automation is a common failure mode. The result is an exception automation system that itself generates exceptions meta-failures that are harder to detect and more expensive to resolve than the original manual exceptions.
Correction: Automate exception routing and prioritization first surfacing exceptions to the right human faster, with relevant context pre-assembled. Automate exception resolution only after: (a) the exception type has a well-defined decision tree with documented edge cases, and (b) the exception volume is high enough that the automation build cost is justified by the Breakpoint Calculator.
4. Agent-First Architecture
Deploying AI agents before deterministic automation is a category error. Agents are appropriate for the specific intersection of high complexity, high exception frequency, and high judgment dependency. Deploying agents on processes that are high-volume and low-complexity is expensive, unpredictable in failure modes, and difficult to debug a simple rule-based automation would be faster, cheaper, and more reliable for the same task.
Anthropic’s research on agent architectures explicitly recommends preferring simpler solutions before adding complexity: “use LLMs only when necessary, and use the simplest possible solution for the task.” The guidance specifically recommends verifying that a problem cannot be solved well with a prompt chain or traditional automation before deploying agent-class infrastructure.[8]
Correction: Always build Class 1 → Class 2 → Class 3 in sequence. Agents should be layered onto an existing deterministic foundation, not used as a replacement for one.
5. Premature Complexity
Adding sophisticated tooling before volume justifies it creates maintenance burden without operational return. A 50-order/day business running self-hosted n8n with custom middleware, a dedicated data warehouse, and AI-assisted support is spending money on architecture designed for a business 10–20× its current size while paying the maintenance tax of that complexity at current revenue. Premature complexity also locks in architectural decisions before the business has enough operational data to make them well.
Correction: Apply the Breakpoint Calculator before any implementation. If payback period exceeds 12 months at current volume, the implementation is premature. Note the volume threshold that makes it rational, and build at that threshold.
6. Automation Without Observability
An automation that fails silently is worse than no automation. Unmonitored workflow failures are consistently discovered by customers before they are discovered by operators: a return that was not processed, an inventory sync that stopped running, an email sequence that sent the wrong message to the wrong segment. Without alerting, error queues, and audit logs, automation creates invisible operational risk that is particularly difficult to diagnose because the failure point is hidden inside automated infrastructure.
Correction: Every automation must have: a failure notification path (Slack alert or email), an error queue for failed executions with human review protocol, and a defined review cadence (weekly minimum). Observability cost is low; the cost of a silent failure at scale is not.
What Changes When AI Agents Enter the Stack
AI agents LLM-backed systems capable of multi-step reasoning, tool use, and adaptive decision-making represent a qualitatively different class of automation. Understanding where they create genuine leverage requires precision about both what they do well and where their limitations are.
Where Deterministic Automation Reaches Its Ceiling
Rule-based automation fails predictably in three conditions:
Input variability exceeds rule coverage. A customer support macro library handles 80% of cases well. The remaining 20% unusual combinations of issues, multilingual inputs, emotionally charged context, novel scenarios produce low-quality auto-responses that damage trust. At 50 orders/day, this 20% is 1 ticket per week. At 2,000 orders/day, it is 12 tickets per day.
Resolution logic requires contextual synthesis. Determining whether a high-value customer’s return exception request should be approved requires synthesizing order history, customer lifetime value, stated reason, product category, and current inventory position simultaneously. A rule tree covering all combinations becomes unwieldy; an agent with access to these data sources handles the synthesis naturally.
Output volume exceeds human review capacity. At sufficient scale, the cost of human review on every output exceeds the cost of agent autonomy with sampled oversight and an escalation protocol.
Where Agents Create Real Leverage
Anthropic’s agent architecture guidance identifies the highest-value agent deployments as those with: well-defined success criteria, verifiable outputs, tool access limited to task requirements, and explicit human escalation paths. In e-commerce, this maps to:
Customer support first response: An agent with access to the order management system, carrier APIs, return platform, and customer history can resolve standard support contacts without human involvement and generate context summaries for the cases it escalates. Intercom’s 2024 benchmark data found first-contact resolution rates of 45–67% for well-configured e-commerce support agents, with the variance attributable primarily to knowledge base quality rather than model capability.[9]
Inventory and procurement drafting: Agents that monitor inventory signals and draft purchase orders for human approval compress procurement cycle time without removing human authorization. This augmentation model agent drafts, human approves is the correct starting point for agent deployment, not full autonomy.
Anomaly detection and alerting: Agents monitoring performance data across channels (ad spend efficiency, inventory velocity, support volume patterns) can surface anomalies with synthesized context faster than human dashboard review. This is a high-value, low-risk agent deployment because the agent is generating alerts, not taking actions.
Where Agents Create Unnecessary Complexity
Agents should not replace deterministic automation for processes that are rule-reducible. If the decision logic can be written as a decision tree without meaningful loss of quality, an agent is over-engineered for the job and importantly, the agent will be less predictable than the rule tree for the same outcome.
Stanford HAI’s 2024 AI Index Report documents that real-world LLM accuracy on complex reasoning tasks remains highly sensitive to prompt design, context quality, and task fit. The report specifically notes that benchmark performance improvements do not linearly translate to production accuracy improvements on domain-specific tasks.[27] Operators should plan for agent accuracy of 85–92% on well-defined e-commerce tasks as a baseline, not 99%+. An 8–15% error rate on 60 daily support contacts is 5–9 errors per day requiring detection, escalation, and correction. The infrastructure to catch those errors must be built before agent deployment, not after.
A critical sequence rule: build the error-detection infrastructure before deploying agents, not after. This is the most commonly inverted sequence in agent deployments.
Implementation Sequence
Sequence matters as much as selection. The most common implementation failure is building in the wrong order sophisticated downstream automations before upstream data quality is established, or complex integrations before process definitions are stable.
The Correct Implementation Order
Phase 1 Process Stabilization (Before Any Automation) Map current state. Document every significant operational process. Identify exception types and frequencies. Measure actual time-per-execution for the 10 highest-volume processes. Run the Breakpoint Calculator. Identify the 3 automations with lowest payback period.
This phase takes 2–4 weeks for a team doing it rigorously for the first time. It is not glamorous. It is the most important phase, because everything built in subsequent phases will be built on assumptions established here.
Phase 2 Single Source of Truth Data Infrastructure Before automating any process dependent on inventory, customer, or order data: establish that the data sources used are accurate and consistent. An automation built on unreliable data is worse than no automation because it acts on bad data at scale. Concretely: establish a single inventory source of truth, ensure order management data is clean across channels, and confirm customer records are deduplicated before building any automation that touches them.
Phase 3 Class 1 Automations (Deterministic, Standalone) Implement high-ROI, low-complexity automations first: order notifications, abandoned cart recovery, inventory alerts, basic ticket routing. These build operator confidence with automation, establish the practice of monitoring automation performance, and generate immediate ROI with minimal risk.
Phase 4 Orchestration Layer Once standalone automations are running reliably, introduce the central orchestration layer. This is the workflow engine (Make.com, n8n, or custom middleware) that manages cross-system event flows. Introduce this layer before it is desperately needed not in response to a crisis. Implementation during a crisis produces poor architecture and technical debt.
Phase 5 Class 2 Automations (Orchestrated, Cross-System) With the orchestration layer in place, implement multi-system workflows: returns processing automation, multi-channel order routing, pricing rules, financial reconciliation, supplier PO triggers.
Phase 6 Observability and Monitoring Infrastructure Before adding more automation, ensure the existing stack is fully monitored. Error alerting, audit logs, execution history, and failure queues should be standard on every automation. If monitoring is not in place: stop adding automations and build it first.
Phase 7 AI Agent Deployment (Selective, Validated) Only after Phases 1–6 are complete. Deploy one use case at a time, with accuracy measurement over at least 30 days before expanding agent scope. Build error-detection infrastructure before, not after, agent deployment.
Common Sequencing Mistakes
Deploying agents before building the deterministic foundation. Agents cannot compensate for missing workflow infrastructure. They add variability on top of gaps rather than filling them.
Building custom data infrastructure prematurely. A dedicated data warehouse is warranted at Tier 3+ ($10M+ revenue, 500+ orders/day). Below that, the build and maintenance cost exceeds the value of the additional data accessibility.
Over-investing in enterprise-tier tools before the business has outgrown mid-market equivalents. Moving from Gorgias Pro to Gorgias Enterprise before support volume justifies it, or from Make.com to a custom middleware solution before Make’s limitations have been concretely encountered, creates cost without proportional capability gain.
Final Decision Framework
The following questions produce a decision output. Work through them in order.
Q1: What is your current order volume?
- Under 100/day → Starter Stack. Class 1 automations only. Complexity is a liability at this stage.
- 100–500/day → Growth Stack. Prioritize inventory synchronization, help desk automation, returns portal, and basic orchestration.
- 500–2,000/day → Operator Stack. The orchestration layer is the primary architectural investment. Exception cost reduction is the primary ROI metric.
- 2,000+/day → Scale Stack. Evaluate AI agent deployment for support first-response and demand forecasting. Custom data infrastructure is now warranted.
Q2: What is your exception rate on highest-volume processes?
- Under 3% → Class 1–2 automation is appropriate. Manual exception handling remains manageable.
- 3–8% → Exception routing automation is required. Agent-based resolution may become warranted at sufficient volume.
- Over 8% → Stabilize the process before adding automation. High exception rates indicate process definition instability, which is a prerequisite problem that automation cannot solve.
Q3: What is your current monthly labor cost for manual operational processes? Run the Breakpoint Calculator on your 5 highest-volume processes. If combined monthly labor cost exceeds $5,000, the automation investment at your tier is almost certainly justified on cost alone, without factoring in error reduction or customer experience improvement.
Q4: How many systems does your most complex process touch?
- 1–2 systems → Class 1 automation appropriate
- 3–4 systems → Class 2 orchestration required
- 5+ systems → Class 2 orchestration with careful integration design; Class 3 agent warranted if volume and complexity justify it
Q5: What is your team’s automation maintenance capacity? Every automation requires ongoing maintenance. If no one on the team owns automation monitoring and maintenance, the maximum safe automation footprint is constrained by that capacity gap. Do not build automation that cannot be maintained. Add automation in proportion to the maintenance capacity you can sustainably staff.
Q6: Where does your most frequent manual intervention currently occur? This is your highest-priority automation candidate by revealed preference revealed by where your team actually intervenes. Run the Breakpoint Calculator on this process. The math may not justify immediate automation (if the process is low-volume despite high interruption frequency), but this analysis will clarify whether the problem is automation-addressable or process-design-addressable.
The Compounding Effect
The operators who build the most effective automation stacks share one characteristic: they treat automation as an architecture discipline, not a tool acquisition activity. Each automation investment is evaluated against a consistent economic framework, implemented in a deliberate sequence, and maintained with the rigor applied to any operational system.
The result is a stack that compounds. Each layer of automation reduces the labor cost of the next layer not because the tools are individually powerful, but because the architecture is coherent. Data flows cleanly from one system to the next. Exceptions are routed correctly rather than creating operational paralysis. Human effort concentrates on judgment-requiring decisions rather than rule-reducible tasks.
This is the distinction between automation as a cost center and automation as operational leverage. The difference is not the tools. It is the discipline of asking the right question before opening the vendor comparison spreadsheet:
At what operational complexity does this process become economically irrational to perform manually?
Answer that question first. Then choose the tools.
Sources
[1] McKinsey Global Institute. “The Economic Potential of Generative AI.” McKinsey Digital, 2023. https://www.mckinsey.com/capabilities/mckinsey-digital/our-insights/the-economic-potential-of-generative-ai [Used for: automation maturity quartile analysis. Note: the 3.5× figure reflects the report’s findings on systematic process prioritization vs. tool adoption alone. Readers are encouraged to verify against the source directly.]
[2] [Field Estimate] Operator heuristic derived from practitioner community consensus. No peer-reviewed primary source exists for the specific 8–10% exception rate threshold. Should be calibrated to individual process context.
[3] Shopify. Commerce Trends 2024. Shopify Research, 2024. https://www.shopify.com/research/future-of-commerce [Used for: cart abandonment recovery 5–15% rate; highest-ROI early-stage automation finding.]
[4] Shopify. “E-Commerce Operations Management.” Shopify Enterprise, 2024. https://www.shopify.com/enterprise/ecommerce-operations-management [Used for: multi-channel inventory synchronization failure pattern at 200-order/day range.]
[5] Gorgias. Ecommerce Customer Experience Benchmark 2024. Gorgias, 2024. https://www.gorgias.com/blog/ecommerce-benchmark [Used for: 67% first response time reduction and 40–55% manual ticket reduction from macro automation. Note: vendor-published benchmark; should be treated as directional data, not independent research.]
[6] Gartner. “Integration Platforms and Integration Complexity.” Gartner Research, 2023. https://www.gartner.com/en/information-technology/insights/integration-platforms [Used for: integration debt concept and combinatorial growth of integration pairs. Note: the mathematical derivation (n(n-1)/2 pairs) is independently verifiable; the Gartner attribution is for the “integration debt” framing specifically.]
[7] A2X. “Integration Features Documentation.” A2X, 2024. https://www.a2xaccounting.com/features [Used for: automated reconciliation scope for Shopify/Amazon multi-currency environments.]
[8] Anthropic. “Building Effective Agents.” Anthropic Research, 2024. https://www.anthropic.com/research/building-effective-agents [Used for: agent deployment criteria; prefer simpler solutions guidance; iterative checking as agent value indicator.]
[9] Intercom. Customer Service Trends Report 2024. Intercom, 2024. https://www.intercom.com/blog/customer-service-trends/ [Used for: 45–67% first-contact resolution rates for well-configured AI support agents. Note: vendor-published benchmark; treat as directional data. Variance attributable to knowledge base quality finding is from this source.]
[10] McKinsey & Company. “Retail’s Need for Speed: Unlocking Value in Omnichannel Delivery.” Retail Practice, 2023. https://www.mckinsey.com/industries/retail/our-insights/retails-need-for-speed-unlocking-value-in-omnichannel-delivery [Used for: ML-based demand forecasting reducing inventory carrying cost 15–30% vs. rule-based reorder systems.]
[11] McKinsey & Company. “Automation in Logistics.” Operations Practice, 2023. https://www.mckinsey.com/capabilities/operations/our-insights/automation-in-logistics [Used for: 20–35% operational cost reduction in mature retail automation programs.]
[12] Shopify. Official Pricing Page. https://www.shopify.com/pricing (Shopify Plus: https://www.shopify.com/plus/pricing)
[13] Klaviyo. Official Pricing Page. https://www.klaviyo.com/pricing
[14] Gorgias. Official Pricing Page. https://www.gorgias.com/pricing
[15] Loop Returns. Official Pricing Page. https://www.loopreturns.com/pricing/
[16] Shopify. “Shopify Flow Documentation.” https://help.shopify.com/en/manual/shopify-flow
[17] Google. “Google Analytics 4.” https://marketingplatform.google.com/about/analytics/
[18] Linnworks. Official Pricing Page. https://www.linnworks.com/pricing
[19] Make.com. Official Pricing Page. https://www.make.com/en/pricing
[20] Triple Whale. Official Pricing Page. https://www.triplewhale.com/pricing
[21] A2X. Official Pricing Page. https://www.a2xaccounting.com/pricing
[22] Okendo. Official Pricing Page. https://www.okendo.io/pricing/
[23] n8n. Official Pricing Page. https://n8n.io/pricing/
[24] Prisync. Official Pricing Page. https://prisync.com/pricing/
[25] Yotpo. Official Pricing Page. https://www.yotpo.com/pricing/
[26] Google. “Looker Studio.” https://lookerstudio.google.com/
[27] Stanford Human-Centered AI Institute. AI Index Report 2024. Stanford HAI, 2024. https://aiindex.stanford.edu/report/ [Used for: LLM benchmark performance vs. production accuracy gap; domain-specific task accuracy sensitivity to prompt design and context quality. Note: the 85–92% accuracy planning baseline is an [Analytical Derivation] informed by but not directly stated in this source. Readers should not attribute that specific range to Stanford HAI.]
Evidence type key used in this article:
- [n] Cited source, numbered
- [Field Estimate] Operator heuristic; no institutional primary source available
- [Analytical Derivation] Calculated from documented inputs; methodology shown in text
Pricing verified against official vendor documentation as of mid-2025. Verify current pricing directly with vendors before making budget decisions SaaS pricing changes frequently. Enterprise and contract pricing (Brightpearl, Extensiv, NetSuite, Northbeam) varies significantly from published list pricing; treat those line items as directional estimates. Anthropic has not sponsored or reviewed this article.
Related Reading on StackNova Hub
- Claude Pro Review 2026: Is It Worth $20/Month?
- How to Use Claude for Business Operations
- ChatGPT vs Notion AI: Which Is Better for Productivity in 2026?
- Best AI Tools for Solopreneurs in 2026
- How to Build a $0 AI Stack That Replaces a VA
- AI Workflow OS: How to Run a Business with AI in 2026
- The Complete AI Productivity Stack for Business Operators (2026)
- Claude Pro vs. Claude Max: The Definitive Guide for Power Users
- Gemini Advanced vs. Claude Pro: Which AI is Right for Your Business?